 Environment
 Economic
 Social
 Environment
12 Consecutive years
15 years in a row
for the last 10 years
This Initiative reaches out to over 6.4 million citizens
Over 48% of ITC's Total Energy Requirements met from carbon neutral sources.
22 green buildings
 Economic
Turnover has grown 11-fold
Profit has grown 39 times
Total Shareholder Returns has grown at a CAGR of 23.6%
Over $50 billion
Over $8 billion
 Social
Empowering 4 million farmers
Generating over 110 million person-days of employment
Covering nearly 55,000 rural women
Benefitting over 5,25,000 children
Services provided to over 15,00,000 milch animals
Covering nearly 12,500 acres
Training over 46,000 youth
Over 25,000 low-cost sanitary units constructed

It has been our resolve to build an exemplary Indian enterprise that would create enduring value for our country. An organisation that would adopt the credo of putting 'India First' - keeping Country before Corporation and the Institution before the Individual. Over the years, the patriotic sense of 'India First' has grown into a full-blown aspiration to be a National Champion subserving the country's larger priorities. This is not only manifest in the creation of world-class Indian brands, but also in the Triple Bottom Line goals of the Company to nurture larger societal value. The need to sustain global competitiveness in economic value creation, whilst simultaneously creating larger societal value, has led to innovation in business models that seek to synergise the building of economic, ecological and social capital as a unified strategy.
A new paradigm of growth is today called for - an integrated Triple Bottom Line approach that builds competitiveness whilst at the same time ensuring that the environment is nourished and large-scale sustainable livelihoods are created. I call this new paradigm 'Responsible Competitiveness', which to my mind is a pre-requisite to creating a more sustainable future.

'Enterprises of Tomorrow' can bring in transformational change by making societal value creation a conscious strategic decision and not one that banks on corporate conscience alone. ITC has always believed that businesses possess unique strengths to make a larger contribution to society. If the creative and innovative energies that businesses employ to create world-class products and brands are leveraged to deliver social initiatives that serve a larger national objective, it can have a transformative impact on society.
It is this belief that has spurred ITC to craft innovative strategies that orchestrate a symphony of efforts aimed at enriching the environment, creating sustainable livelihoods, empowering local communities and addressing the challenge of climate change.
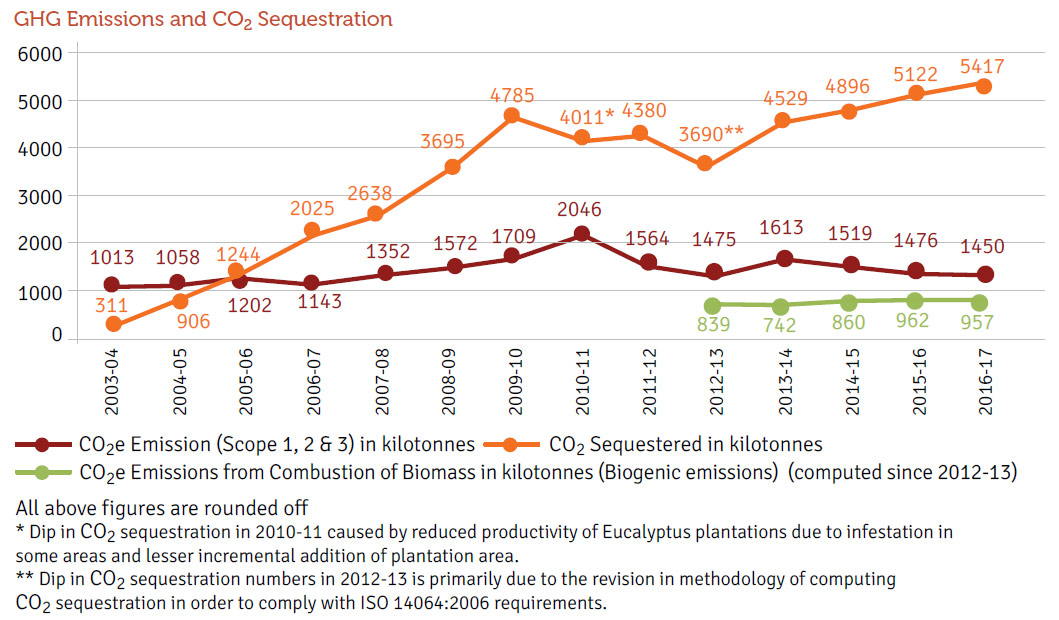
According to Intergovernmental Panel on Climate Change (IPCC)1, the world has an emissions budget of 1,000 billion tonnes of CO2 from 2012 till 2100 to restrict global temperature rise to below 2°C. Impacts of climate change caused by Greenhouse Gas (GHG) emissions are already evident from changing weather patterns across the globe such as shifting rainfall pattern, rising sea levels, increased intensity and frequency of cyclones, droughts and floods. India is also witnessing the impacts of climate change. Cyclone Hudhud and the catastrophic 2015 floods in Southern India are some of the examples of natural calamities with largescale damage. Though floods and cyclones do naturally occur, the intensity of these events are attributable to climate change.
A landmark agreement amongst countries to address climate change challenge was signed in Paris in December 2015 to limit the global temperature rise to below 2°C and work towards adaptation. Subsequent to the ratification of the Paris agreement by major countries, the climate change agreement gained momentum in the Conference of Parties (COP-22) at Morocco with focus shifting to higher commitments and creation of an implementation framework. Widespread support for deeper climate change commitments came not only from different countries but also from various businesses, cities and individuals. However, there are also a large number of climate change deniers. Despite some statements attributed to the US President that seem to support naysayers, several major businesses in the US and a large number of the States are going ahead with plans to reduce their GHG emissions.
India, through ratification of the Paris agreement, has agreed to abide by its commitments under Nationally Determined Contributions (NDC) to UNFCCC. India's commitments are focusing on voluntary targets of reducing emissions intensity, increasing the share of non-fossil based electricity, and creating additional carbon sinks. All these in turn would imply targeted interventions from various industrial sectors in India.
India's ambitious renewable energy programme focuses on all renewable sources including wind, hydro, solar and biomass to achieve its ambitious target of 175 GW of installed capacity by 20222. To accelerate the investment in renewable energy, India had introduced Renewable Energy Certificate (REC) scheme - a market based intervention where incentives are offered for renewable electricity through demand created by giving mandatory Renewable Purchase Obligation (RPO). The International Solar Alliance, headquartered in India, is also helping in accelerating the investment in solar power systems through international collaboration for innovative financing.
Enhancing energy efficiency is pivotal to India's target of reducing emissions intensity. Under National Mission of Enhancement of Energy Efficiency (NMEEE), a large number of programmes were initiated to improve energy efficiency with Perform, Achieve and Trade (PAT) mechanism being a prominent one. PAT is a cap-and-trade scheme to accelerate energy efficiency by setting targets to different industries and incentivising the overachievers through tradable energy efficiency certificates. These energy savings certificates are planned to be traded in power exchanges of India, though the final rules of trading mechanism are yet to be established. PAT, which entered into its second three-year cycle, was deepened and widened to cover more units from existing sectors and addition of three more sectors. According to Bureau of Energy Efficiency3, total energy consumed by units currently covered by PAT is about 50% of total energy consumed in India. This cap-and-trade scheme is likely to contribute significantly towards achieving India's commitment on low-carbon economic growth by incentivising energy efficient production.
Energy security, and energy equity i.e. the accessibility and affordability of energy supply across the population continue to be amongst the biggest developmental challenges for India. Accessibility of low cost energy requires significant investment in electrical grid as well as fuel supply infrastructure. The proposed plan to increase the share of renewables, particularly wind and solar where supply is intermittent, would require investment in smart grid network for fast switching to other sources, investment in quick start-stop power plants for faster ramping along with investment in new and modernisation of existing baseload power plants. Similarly, fuel supply infrastructure, such as natural gas pipeline network and regasification terminals, is significantly lagging and requires huge investment. These create a potential risk of market failure and the possibility of severe energy price shock. With lagging infrastructure, and growing energy price volatility, the investment in creating adequate infrastructure remains a challenge. Severe energy price shock was also identified as one of the top global economic risks by a number of studies including Global Risk Report 2017 published by the World Economic Forum (WEF).
1IPCC's 5th Assessment Report, Synthesis Report, 2014
2Based on India's submission to UNFCCC, as a precursor to Paris Agreement
3https://beenet.gov.in/(S(yhl430bb1iky1halghmhnegl))/GuideLine/
Overview%20and%20Status%20of%20PAT%20Scheme.pdf
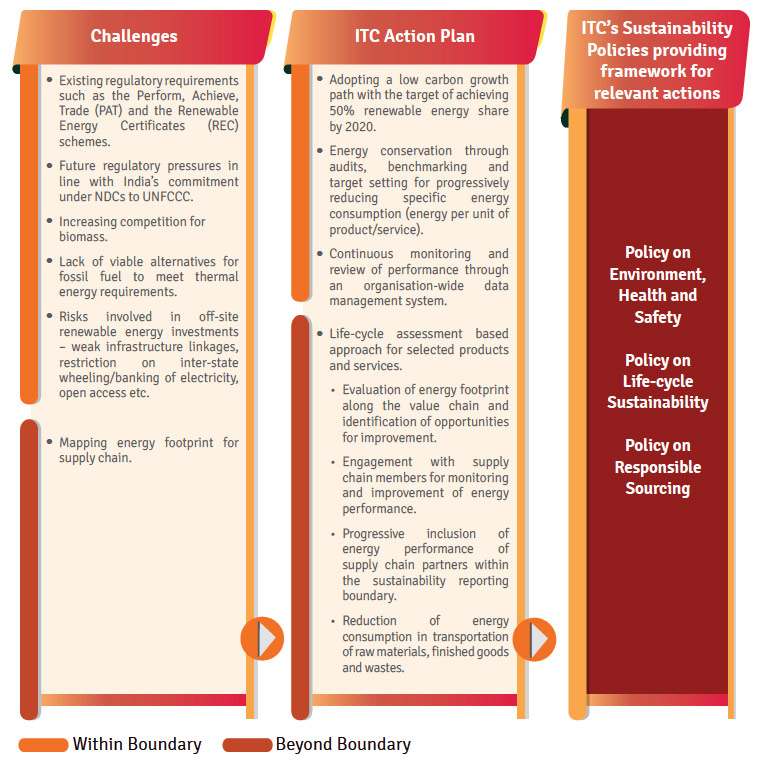
Considering the existing and evolving energy scenarios, as detailed on the previous page, ITC has mapped its Energy challenges and actions plans as below:
ITC has mapped its climate change risks, their impacts & mitigation plans and also Organisation specific opportunities, as detailed below:
ITC's performance of Energy and Greenhouse Gas (GHG) emissions is presented below.
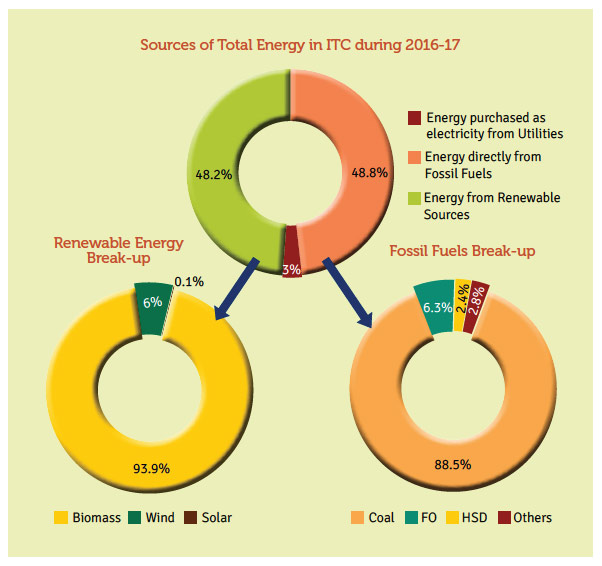
In 2016-17, ITC Units consumed 21,600 Terra Joules (TJ) of energy. Out of the total energy consumed, 48.2% was from renewable energy sources.
Compared to the 21,946 TJ consumed in 2015-16, there was a significant reduction of 1.6% during 2016-17. This was achieved despite the inclusion of two new units within the reporting boundary, (Mangaldai Unit of North East Nutrients Private Limited and Dhulagarh Unit in Foods Division), and primarily due to energy conservation measures implemented across the Units as detailed in subsequent section.
Paperboards and Specialty Papers Division which accounts for about 89% of total energy consumed in ITC, has recorded a decrease in energy consumption by 2.0% as compared to last year. Reduction in energy consumption was achieved by higher utilisation of wind energy (avoiding losses in conversion from thermal to electrical) and energy conservation measures such as installation of higher efficiency CFBC (Circulating Fluidised Bed Combustion) Boiler in Bhadrachalam Unit of Paperboards and Specialty Papers Division.
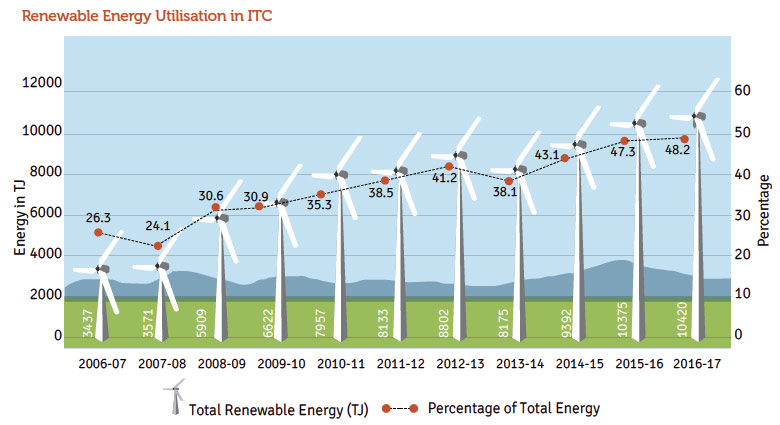
Apart from the reduction in overall energy consumption, ITC has also been able to increase the share of renewable energy in its overall portfolio which has increased year-on-year from 47.3% to 48.2%.
Primary reasons for the increase in renewable energy utilisation from 10,375 TJ in 2015-16 to 10,420 TJ in 2016-17 are as follows:
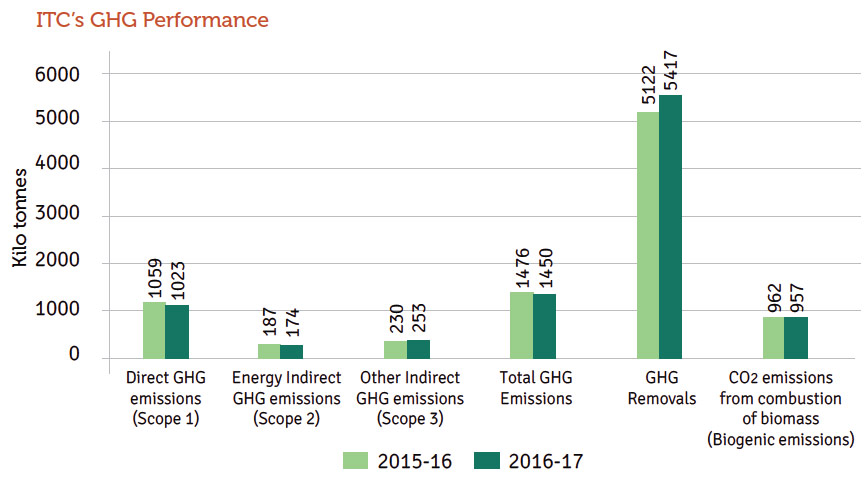
ITC has accounted for the following gases in its GHG inventory: Carbon Dioxide (CO2), Methane (CH4), Nitrous Oxide (N2O), Hydrofluorocarbons (HFCs), Perfluorocarbons (PFCs) and Sulphur Hexafluoride (SF6). Provided below is a comparison of ITC's GHG inventory for 2016-17 with that for 2015-16:
ITC has computed its greenhouse gas (GHG) inventory, including GHG emissions, biogenic carbon dioxide (CO2) emissions and GHG removals, in accordance with ISO 14064:2006, which is the latest international standard specifying principles and requirements at the organisation level for quantification and reporting of GHG emissions and removals. The 2016-17 GHG inventory has been verified by EY at the 'Reasonable Assurance' level.
Both scope 1 and scope 2 GHG emissions have registered a decline over the previous year, mirroring the reduction in overall energy consumption, together with the growing contribution from renewable energy. The reduction in GHG emissions is primarily attributable to the following factors:
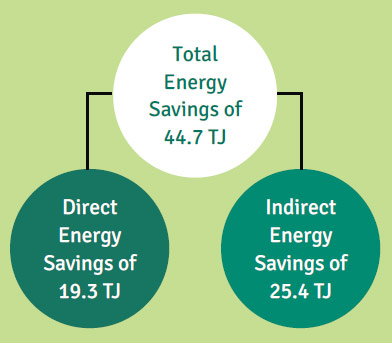
Substantial improvements in specific energy performance were achieved by many units through implementation of various energy conservation measures identified from rigorous audits. As a result of implementation of energy conservation measures, a total saving of 44.7 TJ in energy consumption was achieved in 2016-17.
Energy conservation measures are mentioned in the Annexure to the Director's report in Annual report.
The LEED® Platinum rating accorded to all of ITC's luxury hotels, making it the greenest luxury hotel chain in the world, implies a significant reduction in specific energy consumption with respect to conventionally designed hotels. ITC Hotels are not only energy efficient by design but also conserve fossil fuels - with several of ITC's hotels sourcing significant amount of their electrical energy requirements from wind farms. In order to continually reduce our environmental footprint, green features are integrated in all new constructions and are also being incorporated into existing hotels, manufacturing units, warehouses and office complexes during retrofits. In 2016-17, six ITC Units have sourced more than 90% of their electrical energy requirements from renewable sources.
ITC's continual efforts in reducing energy consumption and increasing renewable energy share across various Units have helped control GHG emissions. In 2016-17, 8,104 tonnes of GHG emissions (Scope 1 & 2) were avoided by the implementation of energy conservation measures leading to savings in both direct and indirect energy.
PSPD Bhadrachalam Cogeneration plant had nine boilers and seven steam turbine generators installed to meet the steam and power demand of the plant. The steam generated from boilers is passed through a battery of turbo generators to generate power and exhaust steam is used for the process. The addition of boilers and turbines over the years to meet growing operational requirements created the opportunity to improve overall Cogeneration efficiency.
PSPD commissioned a new 36 MW Cogeneration Power Plant at Bhadrachalam Unit during December 2016 with a 220 TPH Circulating Fluidised Bed Combustion (CFBC) type boiler designed to generate high pressure steam. This led to three older lower efficiency boilers and turbines becoming redundant. This has resulted in improvement in overall efficiency of Co-generation plant with potential coal savings of about 80,000 tonnes per annum.
In order to continually improve on our performance, ITC Businesses have specific energy and GHG emissions reduction targets. Accordingly, targets have been allocated at the Unit level for achieving business level and overall ITC targets.
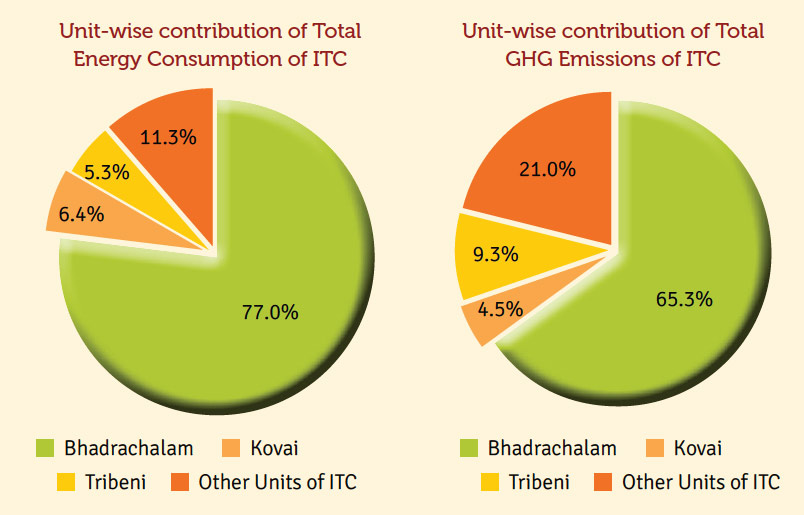
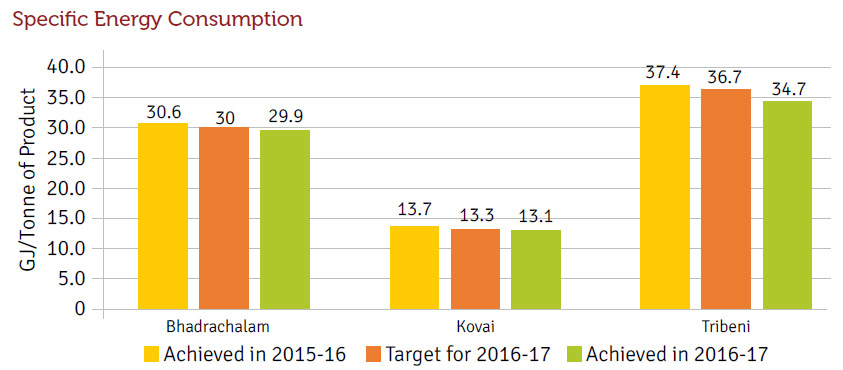
Since the three Units (Bhadrachalam, Kovai and Tribeni) of Paperboards and Specialty Papers Division (PSPD) together account for about 89% of ITC's total energy consumption and 79% of total scope 1 and scope 2 GHG emissions, greater focus is directed towards the energy performance of these Units. The share of these Units in ITC's total energy consumption is shown on the next page.
Performance of three Units of Paperboards and Specialty Papers Division against the target presented on the next page.
Bhadrachalam, Kovai and Tribeni Units improved in specific energy consumption from last year by 2.3%, 4.4% and 7.2% respectively. Reduction in energy consumption by these three Units were the major reason for reduction in overall energy consumption at ITC Level.
Major reasons for reduction in energy consumption by these three Units is presented below.
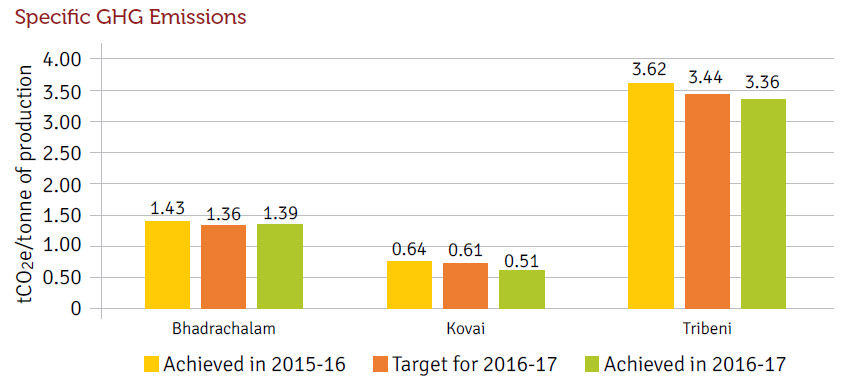
Bhadrachalam, Kovai and Tribeni Units improved in specific GHG emissions (Scope 1 and Scope 2) from last year by 3%, 21% and 7% respectively. Reduction in GHG emissions by these three Units is the major contribution towards reduction in overall GHG emissions at ITC Level.
Kovai Unit has significantly reduced its specific GHG emissions. This was achieved by increasing utilisation of biomass and taking various energy saving initiatives.
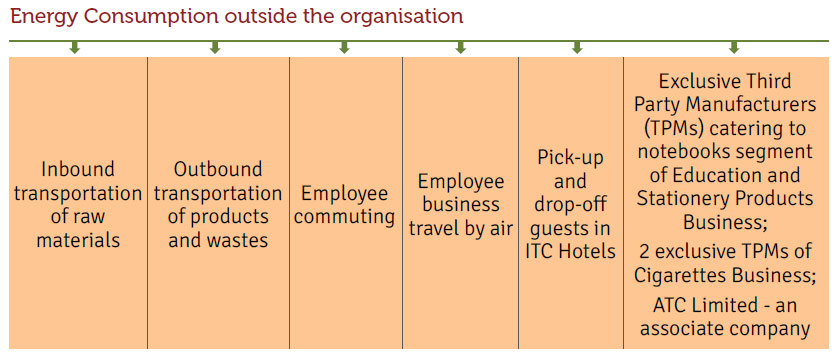
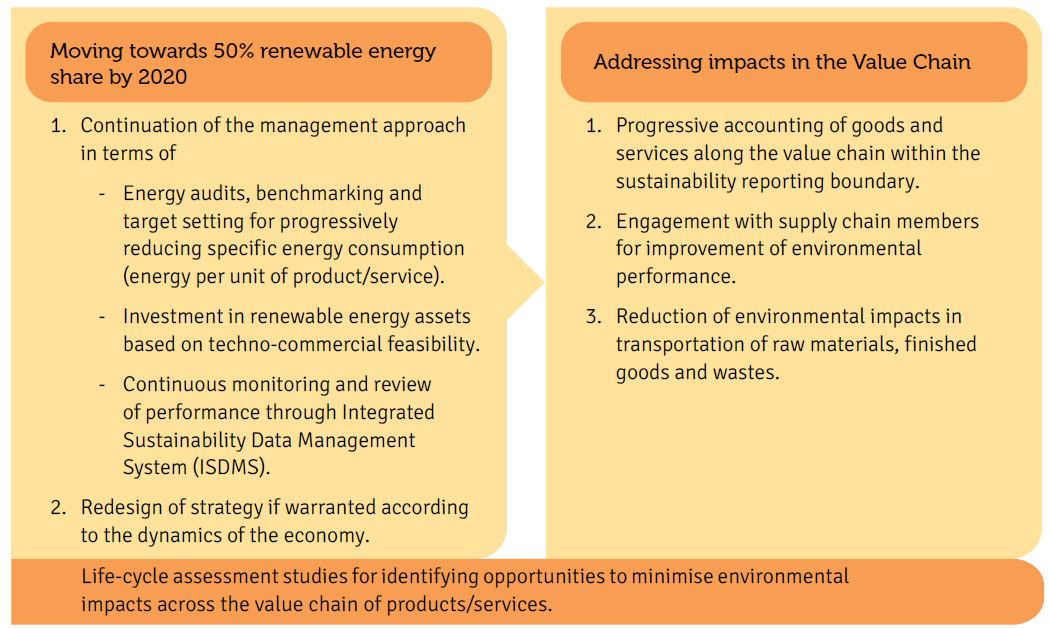
ITC's accounting of its Energy and GHG emissions performance outside the boundary is as presented below. The boundary will be progressively expanded in the years to come, based on deepening of our engagement with the supply chain members.
During the year 2016-17, 2,949 TJ of energy was consumed outside the Organisation. Further, GHG Scope 3 emissions, i.e. outside the Organisation, for the reporting period were 253,206 tCO2e which includes emissions from the energy sources listed above as well as emissions from fertiliser application in farm forestry programmes.
The standards, methodologies, tools and assumptions used for quantification of the GHG emissions and removals by various sources, have been explained at length in the Annexure - Quantification Methodologies: Energy and GHG Emissions.
Trade Marketing and Distribution, which manages logistics of ITC's FMCG Businesses, has optimised its distribution logistics to control its Scope 3 GHG emissions in 2016-17. Specific Scope 3 emissions from transportation, i.e. tonnes of CO2e emission per tonne of product transported, of FMCG products (Cigarettes, Personal Care and Foods) in 2016-17 were reduced by around 8% as compared to the previous year. This was achieved by use of higher capacity vehicles across the supply chain and extensive network de-layering in order to increase direct shipments to destination warehouses, thereby avoiding intermediate movements.
With an objective to evaluate the impacts in the value chain and to identify additional areas for improvement, ITC continues to carry out life-cycle assessment (LCA) studies of its products/services. During the reporting year, one LCA study was carried out which indicates some possible opportunities for improvements.